Introduction
As we all know the word "Graph" From School Times. But What Exactly Graph in Data Structure? So basically "Graph" is a mathematical concept that explores the relationships and connections between different elements.
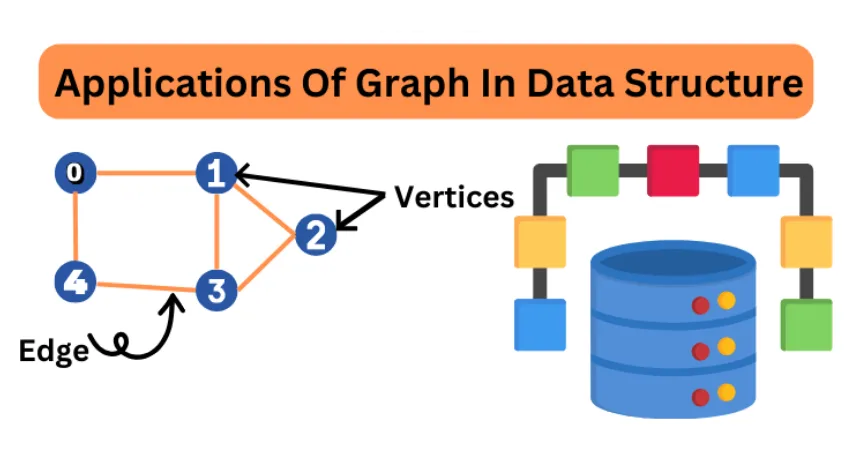
So normally in a graph, we used dots (vertices and nodes) which represent individual elements and also lines (edges) which represent how these things are connected.
The main application of graph in data structure is their ability to represent relationships between data points.
In this blog, we explain graphs in data structure and the application of graph in data structure with examples. So read this blog till the end, and you will get a clear understanding of graphs in data structure.
Enroll in our Programming courses and take the first step towards a successful career today!
What is Graph In Data Structure?
In Data Structure, a graph is a collection of nodes or vertices which are connected by edges. These connections can be either directed (one-way) or undirected (two-way), and they can also have weights assigned to them.
The main use of Graph in data structure is it represents relationships between different entities or elements, and most importantly Graphs are handy for showing lots of different problems in the real world.
Also Read: Garbage Collection In Data Structure
Types Of Graph In Data Structure
In this blog we explain some of the most common types of Graph in Data Structure –
- Undirected Graph
- Directed Graph
- Connected Graph
- Multigraph
- Weighted Graph
Let's explain one by one types of Graph in Data Structure with Examples –
Undirected Graph
An undirected graph is a type of graph where the connections between nodes don't have a set direction. This means that the relationship between nodes is bidirectional.
Characteristics:
- Lines (Edges) without arrows: In Undirected Graph, lines don't have arrows, meaning you can move both ways.
- No parent-child hierarchy: Nodes in Undirected graph, doesn't have parent child hierarchy (tree structure or flow diagrams).
For Example:
- Social networks: Friend connections on social media platforms are undirected because friendships go both ways.
- Road networks: Roads between cities can be traveled in either direction, so they're undirected.
- Circuit diagrams: Connections in electronic circuits don't have a set direction.
- Molecular structures: Bonds between atoms are undirected since they share electrons.
Directed Graph
Directed Graph is a complete reverse of Undirected Graph. In Directed Graph, things are connected to each other, it means it is a type of graph where edges have a direction associated with them. This means that the relationship between nodes is unidirectional.
Characteristics:
- In Directed Graph Edges have a specific direction, indicating one-way connections between nodes.
- Directed Graph have Parent-Child Hierarchies. It means Nodes can have parent-child relationships, creating hierarchical structures.
For Example:
Twitter is a great example of a directed graph. Let's say, People are the nodes, and the connections between them are like "A follows B". It's important to note that "B following A" is a separate connection, going in a different direction.
Also Read: Schedule In DBMS
Connected Graph
In a connected graph, you can reach any node from any other node by following the edges.
Characteristics:
- Every node is accessible from any other node.
- There's a path between every pair of nodes.
- No isolated (Separated from others) nodes or groups exist within the graph.
For Example –
Let's take an example of the Internet, websites (nodes) are connected to each other through hyperlinks (edges). Users can navigate from one website to another, ensuring that all websites are reachable from any starting point, thus forming a connected graph.
Multigraph –
A multigraph is a graph where you can have more than one connection between the same pair of things. So, there can be multiple edges between two points, each representing a different relationship.
Characteristics –
- Multiple edges allowed between the same pair of nodes.
- Can have parallel edges representing different relationships.
- Offers flexibility in representing complex connections between nodes.
For Example –
Multigraph is a transportation network between two cities. There can be multiple routes (edges) connecting the same pair of cities (nodes), representing different modes of transportation or different paths.
Weighted Graph
If each connection between points in your graph has a numerical value assigned to it, the graph is termed a weighted graph. Although, If the connection between points doesn't have numbers, it's an unweighted graph.
Characteristics:
- Each edge has a number called a weight.
- The weight represents the cost, distance, or other value associated with the connection.
For Example:
The best example of a weighted graph is a map with cities as nodes and roads as edges. Because of the numbers on the edges, we can calculate how much time it will take to reach our destination.
Also Read: Leap Year Program In Python | Is 2024 a Leap Year?
Application Of Graph In Data Structure
Social Network Graph
Social networks, like Facebook, is the best example of a social network graph. As we all know, on Facebook, we can see other profile pictures and photos they post, and if we love the post, we generally click on the like button.
So in a social graph, each profile or page is a node, and every connection between them, like likes, is an edge. This helps show how everyone and everything is linked together.
On Instagram, we often receive friend recommendations and see content that matches our interests. Have you ever thought or might be sometimes shocked how Instagram makes these suggestions which we liked the most?
Here is the answer –
- Friend Recommendations: Based on mutual connections or shared interests (Posts), the graph suggests potential friends.
- Content Recommendations: Pages to those already liked or attended by a user can be recommended.
- Community Engagement: Analyzing clusters within the graph helps target specific user groups for community engagement or advertising.
Web Graph –
As we all know, the World Wide Web (WWW) is the largest network of interconnected web pages. Let's say each web page is like a vertex or node in this graph, and the links between pages act as connections, which means edges.
When you redirect the web by clicking on links, you're essentially traversing this graph, moving from one webpage to another.
Did you know? Google uses graphs to organize its knowledge base, which is also known as the "Knowledge Graph."
This graph structure allows Google's search engine to understand the relationships between various entities, such as:
- People
- Places
- Attributes
- Connections
By using this graph based technique, Google can provide more relevant and accurate search results to users, which is helpful for users.
Product recommendation –
Have you ever used Amazon or Flipkart for online shopping? If yes, then you observed one thing on these e-commerce sites: if you add some product or search for some product, they show similar products that you are mainly looking for, right?
How does it work? So basically, these e-commerce websites analyze what you and other users have bought in the past and then create connections between similar products.
So, when you're searching or browsing, they can recommend items based on what others with similar tastes have liked or purchased before.
E-commerce websites typically use a type of graph called a "collaborative filtering graph" or a "user-item graph" for product recommendation.
Conclusion
I hope you get a better understanding of the application of graph in data structure.
Some students may skip these concepts of graphs in data structure, but it is more important if you want to become a successful programmer. You have to know all these things so you can easily crack any interview, no matter how the interviewer asks you a difficult question. You can answer all their questions confidently if you have a strong understanding of data structure.
Want to start a career in Programming?
Technogeeks is the best to learn. Call us +91 8600998107 / +91 7028710777 For Free Career Counseling.