Data Analytics Course in Pune with 100% Placement Assistance
Industry-based, job-oriented, hands-on interactive Data Analytics and AI course in Pune with real-time projects. Learn from working IT professionals with 16+ years of experience.
 >
>
No-cost EMI available
Best AI Powered Data Analytics Training In Pune With 100% Placement Assistance
Are you looking for a Data Analyst Course near me or Data Analytics along with an Artificial Intelligence course in pune ? Look no further. Our well-designed data analytics courses in Pune with placement will provide you hands-on training and will be more convenient as it is located near you.
Pune is mostly known for India’s education and IT hub. It also offers a wide range of AI Integrated data analysis courses in Pune that will help both beginners and professionals to upskill their skills in the field of Data Analysis. Technogeeks’ 75 hrs interactive Data Analytics Course and Artificial Intelligence training in Pune combines industry-based, job-oriented, hands-on, interactive training with 60 hrs of assignments and 40 hrs of real-time data analytics hands-on projects with source code.
The AI Powered Data Analytics Courses in Pune were made by IT professionals with years of experience. The training for data analyst courses online along with AI tools is made for a wide range of students. We have set it up with the current needs and standards of the industry. The Data Analytics Course Training combines theory and hands-on work. It’s a full-fledged data analytics course in Pune with a focus on business. This AI Driven Data Analytics Training online and offline will help you to become a Data analytics expert. Hands-on practice with Python programming in the course gives you the skills you need to control all of Python programming.
The Data Analytics & Visualization with Python training classroom is inclined towards hands-on practice to give students Python-related relevant skills to get control over all the aspects of Python programming, Data Analytics & Visualization using Python, Tableau or Power BI. The data analyst training with AI Automation also includes Python libraries for data visualization:- Seaborn, Matplotlib data analytics:- Numpy, Pandas Statistical analysis and predictive modeling will also be taught for business gain.
Course Curriculum
- What is Python and brief history
- Why Python and who use Python
- Discussion on Python 2 and 3 Unique features of Python
- Discussion on various IDE's
- Demonstration of practical use cases
- Python use cases using data analysis
- Installing python
- Setting up Python environment for development
- Installation of Jupyter Notebook
- How to access our course material using Jupyter
- Write your first program in python
- Python built-in functions
- Number objects and operations
- Variable assignment and keywords String objects and operations
- Print formatting with strings
- List objects and operations
- Tuple objects and operations
- Dictionary objects and operations
- Sets and Boolean
- Object and data structures assessment test
- Introduction to Python statements
- If, elif and else statements
- Comparison operators
- Chained comparison operators
- What are loops
- For loops
- While loops
- Useful operators
- List comprehensions
- Statement assessment test
- Game challenge
- Methods
- What are various types of functions
- Creating and calling user defined functions
- Function practice exercises
- Lambda Expressions
- Map and filter
- Nested statements and scope
- Args and kwargs
- Functions and methods assignment
- Milestone Project (Making tic-tac-toe in python)
- Process files using python
- Read/write and append file object
- File functions
- File pointer and operations
- Introduction to error handling
- Try, except and finally
- Python standard exceptions
- User defined exceptions
- Unit testing
- File and exceptions assignment
- Python inbuilt modules
- Creating UDM-User defined modules
- Passing command line arguments
- Writing packages
- Define PYTHONPATH
- name and main
- Object oriented features
- Implement object oriented with Python
- Creating classes and objects
- Creating class attributes
- Creating methods in a class
- Inheritance
- Polymorphism
- Special methods for class
- Assignment – Creating a python script to replicate deposits and withdrawals in a bank with appropriate classes and UDFs
- Collections module
- Datetime
- Python debugger
- Timing your code
- Regular expressions
- StringIO
- Python decorators
- Python generators
- Install packages on python
- Introduction to pip, easy_install
- Multithreading
- Multiprocessing
- What is SQL?
- Why do we need SQL integration with Python?
- Data types in SQL
- DDL, DML, and TCL sub-languages in SQL
- Significance and type of Joins in SQL
- Where clause in SQL
- Group by clause in SQL
- Create command in SQL
- Insert command in SQL
- Select command in SQL
- Select command variants in SQL
- Update command in SQL
- Delete command in SQL
- Drop command in SQL
- Truncate command in SQL
- Commit and rollback concepts in SQL
- SQL integration with Python
- Table operations in SQL using Python
- Working on multiple tables using Python and SQL
- CRUD operations in SQL
- REST principles
- Creating application endpoints
- Implementing endpoints
- Using Postman for API testing
- CRUD operations on database
- REST principles and connectivity to databases.
- Creating a web development API for login register and connecting it to database
- Deploy the API on local server
- Data Analysis using Numpy and Pandas
- Data Visualization using Matplotlib and Seaborn
- Dealing with missing values, NaN values
- Standard scaler
- Correlation-based processing
- Divide data in test and train splits to supply to machine-learning algorithms
- Time series analysis
- Reshaping Data
- Data Manipulation as per requirement
- Derive columns based on rules
- Filtering data
- Compression and decompression techniques
- Introduction in Excel
- Data Cleaning & Preparation
- Formatting & Conditional Formatting
- Lookup Function
- Analyzing data with Pivot Tables
- Charts
- Data Visualization/Dashboarding using excel
- Data Analysis using statistics
- Introduction to data analysis
- Why Data analysis?
- Data analysis and Artificial intelligence bridge
- Introduction to Data Analysis libraries
- Data analysis introduction assignment challenge
- Introduction to Numpy arrays
- Creating and applying functions
- Numpy Indexing and selection
- Numpy Operations
- Exercise and assignment challenge
- Pandas series
- Introduction to DataFrames
- Missing data
- Groupby
- Merging, joining and Concatenating
- Operations
- Data Input and Output
- Pandas in depth coding exercises
- POC – Analysis of e-commerce dataset using pandas
- POC – Getting insights on employee salaries data using data analysis in python
- Matplotlib
- Plotting using Matplotlib
- Plotting Numpy arrays
- Plotting using object-oriented approach
- Subplots using matplotlib
- Matplotlib attributes and functions
- Matplotlib exercises
- Seaborn
- Seaborn visualization
- Categorical Plot using Seaborn
- Distributional plots using Seaborn
- Matrix plots
- Grids
- Seaborn exercises
- Project – Getting insights using python analysis and visualizations on finance credit score data.
- Pandas built-in data visualization
- Data visualization assignment
- Capstone Project
- Python and Web-based Project Development
- You can select the Power BI or Tableau based on your preference of business intelligence tool to visualize and analyze the data sets.
- Module 20 – Data Visualization using Power BI
- Comparison Between Power BI & Programming Based Data Visualization
- Need Of Power BI
- Types Of Data Sources Supported By Power BI For Report Development
- How To Build Report & Dashboard in Power BI
- How To Build Charts In Power BI
- Data Visualization Using Power BI Features
- Types of Graphs
- Multiple graphs combinations
- Multiple file formats supported in Power BI
- Data analysis without visualization
- Data analysis with visualization
- OR
- Module 20 – Data Visualization using Tableau BI Tool
- Comparison Between Tableau & Programming Based Data Visualization
- Need Of Tableau
- Types Of Data Sources Supported By Tableau For Report Development
- How To Build Report & Dashboard in Tableau
- How To Build Charts In Tableau
- Data Visualization Using Tableau Features
- Project use cases Introduction
- Project Scenarios
- Project life cycle
- What is version controlling in project management
- What is GitHub
- Significance of GitHub in project management
- Code submission for testing and deployment
- Predictive analytics tools and techniques
- Project best practices
Our trainers are experts in their fields. They simplify complex concepts for the students and make them easy to understand. They solve each and every type of student's query. Their teaching method is more focused on real-time examples, preparing the students for industry interviews. Students will have one-on-one coaching sessions with them so that they will be able to ask questions at any time.
Key Highlights of Our Trainers:
- Certified Professionals with Over 15+ Years of In-Depth Experience
- Imparted Knowledge to Over 2,000 Students Annually
- Demonstrated Strong Theoretical and Practical Expertise in Their Respective Domains
- Possess Expert-Level Subject Knowledge and Stay Current with Real-World Industry Applications
Why Choose Technogeeks?
Everything you need to launch your career in tech
Tools & Technologies You'll Master
23+ industry-standard tools covered in this program
Book Your Seat Today!
Start your journey with just ₹5,000. Watch a free demo first — pay the rest only after you're confident. No-cost installments available.
Training to Placement Journey
From your first session to landing your dream job — every step mapped out.
Frequently Asked Questions
Core Python
- Syntax & Numerical Operators
- Data Types
- Control Flow
- Loops
- OOP
- Collections
- Regular Expression (Regex)
- File Handling
- Exception Handling
- SQL Integration
- SQLite Database
API Design Using Flask
Analytics
- Numpy, Pandas, Excel, CSV, JSON handling using a data frame.
Visualization with Python Libraries
- Matplotlib
- Seaborn
Advance Excel for Data Analysis
Visualization, Analytics & BI Tools
- Power BI
- Tableau
To get a job in data analytics, you typically need a bachelor's degree. Graduating in relevant fields such as statistics, computer science, information technology, or mathematics can be particularly beneficial.
Also, you become a Data Analyst through Technogeeks Data Analytics courses in Pune. We provide industry based training with real time projects and 100% Placement Assistance.
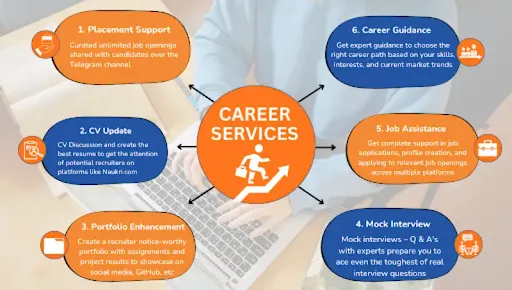
The Data Analytics course syllabus is designed by industry experts to ensure candidates gain knowledge aligned with current market demands. Upon completing the training, candidates will undergo multiple mock interviews, CV preparation, profile enhancement, and receive a course completion certificate.
- Python Programming – Beginner, Intermediate to Expert Level
- Python for Data Science
- Python for Artificial Intelligence
- Python for Machine Learning (ML)
- Python for Deep Learning (DL)
- Python for Natural Language Processing (NLP)
- Python for Full Stack Web Development
- Python for Data Visualization
- Python for Data Analytics
Yes, a Data Analytics certificate is worth it. With a Data Analytics certification, you can prove your skills and stand out from other candidates.
As we all know certification is important for changing the career path. If you search for a data analytics certification course in Pune look no further then Technogeeks.
The Technogeeks Data Analytics course in Pune provides practical experience through hands-on projects and daily assignments, helping you expand your career options. You also get the chance to learn from industry experts, as you become an expert by learning from the expert.
Enroll now and start your journey to becoming a Data Analyst expert!
KYC - Know Your (Data Analytics) Course
- Batches Completed: 200+
- Students: 2000+
- Learning Mode: Live Interactive Online training, Classroom training in Pune
- Training hrs: 75 hrs of training
- Assignments Duration: 60 hrs of Assignments
- Projects: 40 hrs of Real-time Projects (2 major projects)
- Tools Covered: Python programming, Python libraries for visualization & analytics, Advance excel, Tableau, Power BI
- Modules: 21
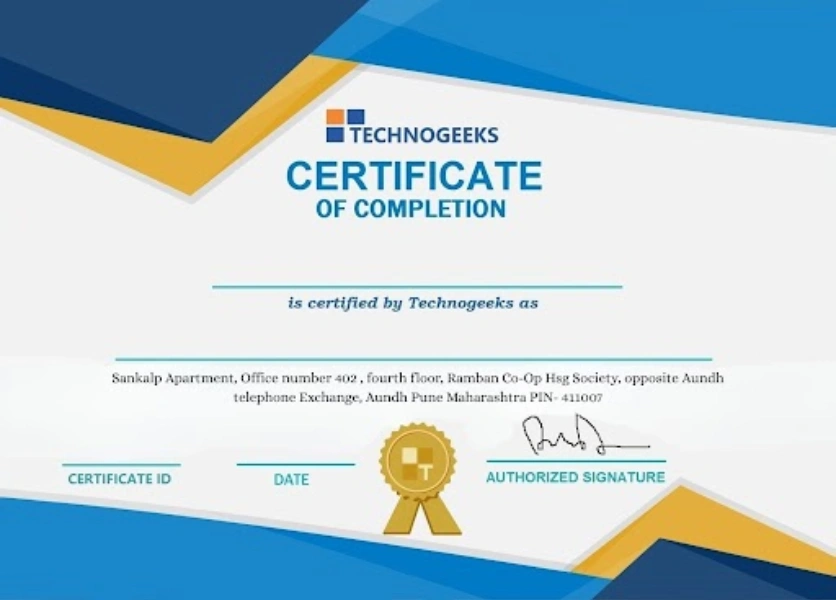
- Certificate: Course Completion Certificate with unique verification ID
- Mentor Support: 1:1 Mentorship
- Resources: Classroom Recordings, Notes, Assignments, Projects, Interview FAQs
- Mock Interview
- Job Assistance: Telegram channel for placement Assistance: https://t.me/technogeekssolutions
- Reviews: 1700+ reviews on Google by students with a 4.8 average rating
Managers, accountants, marketing analysts, or anyone looking for a career change and wanting to improve their data analytics skills with an aptitude for analysis should consider data analytics training and can secure a job with the help of this course.
Following domain professionals can apply for the data analyst training:
- IT, Banking, and Finance
- Marketing, Sales, and Supply Chain Networking
- Beginners in the data analytics field
- Students in the UG and PG programs
Technogeeks Software Training Institute is the best place to learn Data Analysis in Pune.
The Data Analytics course syllabus includes Python programming from basic to advanced. So you don't require any prior coding knowledge. Instructors are working professionals.
The course includes tools like Python programming, SQL, Power BI, Tableau, and Advanced Excel from industry experts.
You can check https://t.me/technogeekssolutions to see what students say about our Data Analytics Course.
Technogeeks is the best institute for providing Data Analytics classes with 100% placement assistance near Aundh, Pune, Maharashtra.
If you want to join the Data Analyst course, then you must have prior knowledge of Python or any related programming language that supports Data Analyst libraries. If you don't have such knowledge, don't worry, as Technogeeks offers this course with a combo of Python programming and SQL integration with Data Analyst libraries.
Data visualization is one of the mandatory skills to understand large volumes of data as a summary in the form of graphs and charts, so in Technogeeks we also cover Data Visualization tools and libraries in the same course.
Again, it depends on your ability to grasp difficult concepts and, of course, your dedication to studying. The more time you practice, the clearer your concepts will become.
Our Data Analyst Course near me is designed to provide you with the required skills like statistical analysis, data visualization, and SQL etc needed to master in the Data Analytics field. Whether you are a beginner or looking to build your career in Data Analytics, our course provides the flexibility to learn locally also.
The Data analytics course from Technogeeks is taught in a Pune classroom with the help of Google Classroom software. All course sessions are recorded while live streaming, where students can interact with the instructor during a live data science class.
And you can get the same experience as being in the classroom.
Yes, we provide placement assistance in which how we work on real-time projects will be taught, and resume preparation and Job openings will also be provided. More than 80% of candidates have changed their profile by getting promotions or new job offers on good packages.
Checkout our Telegram Channel for Placement Assistance: https://t.me/technogeekssolutions
If you miss classes, you can get recording sessions of the lectures.
The data analytics course from Technogeeks is taught in a Pune classroom with the Google Classroom software. All sessions of the course are recorded while streaming live, where students can interact with the instructor during a live data analytics class.
And you can get the same experience as being in the in-person classroom.
Absolutely, a career in data analytics is full of promise. Organizations across many industries really need data analysts. These experts help them make smart choices (to compete in the market). With so much data, professionals who can discover insights are really in high demand.
The stats mentioned from the US Bureau of Labor Statistics show the field is booming. A projected 22% job growth from 2020 to 2030 is a big deal. This shows how much we rely on data driven decision today. a job where new tech & tools are always being added. So, if you're thinking about a career, data analytics is a smart path to consider.
Coding is not necessary in Data Analytics, but it helps in many situations. In some companies, they have requirement of coding.
In some data analyst jobs, coding is a must. You might use Python or R to work with big data to make cool charts or build smart (and attractive) models.
But not all data analyst jobs need coding. Some use easy tools, no code required. You can find insights and make reports without coding by using tools: Tableau, Power BI, etc.
How much coding you need depends on the company, data complexity, and job specifics. If you're into data analytics, check the job needs. Coding skills help, but they're not always a must.
Python programming is mostly used in Data Analysis because of its powerful libraries like Pandas, NumPy, and Matplotlib, which make easy data manipulation, numerical computation, and visualization possible.
Data analytics isn't really hard, but it's also not easy. It's like learning to ride a bike or play an instrument.
Some people find it simple, like putting together a puzzle. But you can still learn if you don't. Like learning any skill, it takes time and practice.
Don't Be Scared:- Dive in, learn, make mistakes, and keep learning.
Data analysts have a bright future, as every company, from startups to MNCs, depends on data for decision-making.
As per the US Bureau of Labor Statistics , data analyst jobs are expected to increase by 33% from 2020 to 2030, much faster than average.
To learn Data Analysis using Python, you can enroll in the Technogeeks Data Analysis with Python Course, where you can learn in structured and organized manner , like we start with building logic using Python programming, from basic to advanced. We also cover file system integration and database integration with Python, which is a mandatory skill to understand a variety of data, like structured, semi-structured, etc., and after that, we cover data analysis and Data Visualization along with projects and assignments.
AI does not replace data analysts, because in this field, human understanding and expertise are still needed to understand complex data and make important decisions accordingly.
Having experience as a Data Analyst can be advantageous. Freshers with strong analytical skills, dedication to learning, and a basic understanding of Python programming can do great as Data Analyst after completing professional training from the Technogeeks Software Training Institute in Pune.
Pune , oh, it's known as the "student's paradise" for some really good reasons. You see, this city has this amazing blend of rich educational opportunities and a vibrant, youthful culture.
First off, there are world-class universities and colleges in Pune. The place is like an educational hub.
You've got places like the University of Pune , which is a big name in itself, and then there's the Film and Television Institute of India (FTII), which is renowned globally for cinema and television education.
Some of the most visited attractions in Pune are:
- Sinhagad Fort
- Shaniwar Wada
- BAPS Swaminarayan Temple
- Aga Khan Palace
- Saras Bag
- Pashan Lake
- Khadakwasla Dam
With a student-friendly environment, it's no wonder they call it a "student's paradise."
Students from all over the country flock to Pune to enroll in various programs. And it's not just about the University of Pune; there are numerous other institutions that provide a wide range of courses, like Technogeeks .
The legacy of education in Pune is truly rich, and that's why students come here for a promising future.
But Pune isn't just about academics. Making it a hotspot for professionals, the city offers excellent job opportunities.
It's considered the second-largest IT hub in India, so tech enthusiasts find their haven here.
And let's not forget the weather. Pune boasts a lovely climate throughout the year, which is quite a relief compared to some other cities with extreme temperatures.
A basic knowledge of Python programming is important for data analysts, including knowledge of data structures, OOPs concepts, control flow, functions, and libraries, which are mostly used in Data Analysis.
Enrolling in a Data Analyst Course near you can offer a wide range of benefits. This Data Analyst course will help you to learn the most required skills that are in high demand in the job market. Learning Data analysis skills and being expert in can open up a variety of career opportunities for you. Enrolling in a course near you will give more flexibility in terms of scheduling and convenience. You can attend your classes without having to travel long distances, which will make it easier to balance your other jobs. Therefore, a Data Analyst Course near you can be a great step in your future in having great success ahead.
Absolutely yes, You can learn the basics of data analysis and get ready for an entry-level job in the duration of three months with focused study and well hands on practice. Becoming an expert takes a longer time, but you can build a strong foundation in essential skills and tools during these 3 months.
Let's take a look towards Data Analyst Course in Pune Learning Path
- Data Analytics using Advanced Excel
- Data Analytics using Python Programming
- Mathematical Computing using Numpy
- Data Manipulation using Pandas
- Data Vizualization using Seaborn and Matplolib
- SQL Certification
- Business Analytics with R and Excel
- Data Analytics in R
- Tableau Desktop Certification Training
If you are searching for the best data analyst course in Pune, Technogeeks is one of the best data analyst institute in pune which provides industry-based training and hands-on practice which will prepare you for real-world challenges in data analysis and business intelligence.
Data analyst course fees are quite affordable compared to others. At Technogeeks, you can book your seat for just INR 5,000 which will help you to connect with our career counselors and post registration if you enroll for the course then this INR 5,000 will be adjusted in total fees of the course and you need to pay just the balance amount then.
Yes, This placement oriented data analytics training is completely AI integrated. In this data analytics Class you learn cleaning data with python. Also Prompt Engineering for Making LLMs and write SQL, code Python, and fix errors for us. Predictive Machine Learning, Sentiment Analysis (NLP), AI-Powered Dashboards, Anomaly Detection.
AI helps in data analytics like manual sorting into an automated and predictive powerhouse. below is simple broken down how it helps :
- Automates Data Cleaning
- Answers Questions in Plain English
- Predicts Future Trends
- Finds Hidden Patterns
- Writes Code for Analysts
AI will definitely not replace data analysts, on other hand AI-augmented analysts will replace those who do not adapt. because we can easily automate routine tasks like data cleaning and writing basic SQL queries. It lacks human thinking for business decisions and communication. So to make your career future-proof you have to learn to bridge traditional business intelligence with generative AI. The Technogeeks Data Analytics with AI Course is the perfect launchpad for you.
Technogeeks Software Training Institute is the best place to learn AI Data Analysis in Pune. The Data Analytics course syllabus with gen ai includes Python programming from basic to advanced. So you don't require any prior coding knowledge. Instructors are working professionals. The ai powered data analytics class includes tools like Python programming, SQL, Power BI, Tableau, and Advanced Excel from industry experts. You can check https://t.me/technogeekssolutions to see what students say about our ai driven Data Analytics Course.
There is a difference between Data Analytics and AI Focused Data Analytics. In Data Analytics we basically collect data or information, clean data, and analyze data . Data Analytics mainly focuses on Excel, SQL, Power BI, Python . We learn to find patterns from past data . more manual processes we have to do to create reports and dashboards .
But in AI Focused Data Analytics , we are focusing on how to use AI tools for automating tasks which saves time . learn SQL, Power BI, Python and many AI tools . by which we predict future trends using ai .
What Our Students Say
2,100+ verified Google reviews from real students
Our alumni works here
Join thousands of successful professionals
Find Us in Pune
Head Office at Aundh — also available online across India
Book Free Demo
Fill your details and our counselor will contact you
View All Pune Locations
Data Analytics Course Certification Training locations in Pune :
Bajirao Road [411002], Yerwada [411006], Kasba Peth [411011], Dhanori [411015], Pune City [411022], Hadapsar S.O [411028], Airport [411032], Afmc [411040], Karve Road [410038], Ammunition Factory Khadki [411003], Aundh [411007], Dapodi [411012], Gokhalenagar [411016], Kudje [411023], Kothrud [411029], Mundhva [411036], Tingre Nagar [411000], A.R. Shala [411004], Baner Road [411004], Magarpatta City [411013], Botanical Garden [411020], Khadakwasla [411024], Lokmanyanagar [411030], Bibvewadi [411037], Bhavani Peth [411042], Dhayari [411041], Dhankawadi [411043], C D A O [411001], Shivajinagar [411005], Parvati [411009], 9 Drd [411014], Armament [411021], Donje [411025], Bopkhel [411031], Bhusari Colony [411038], Haveli [411045], Jambhulwadi [411046], Lohogaon [411047], Khondhwa [411048], Anandnagar [411051], Navsahyadri [411052], Chatursringi [411053], Gokhalenagar [411055], Warje [411058], Mohamadwadi Kadvasti [411060], Janaki Nagar [411066], Aundh [411067], Pimpri Chinchwad [411078], Nanded [411230], Gondhale Nagar [412029], Sathe Nagar [412047], Alandi Devachi [412105], Ambarvet [412115], Ashtapur [412207], Manjari Farm [412307], Phursungi [412308], Viman Nagar 411014, Shaniwar Peth [413337], Wakad [411057], Kothrud [411038], Shivaji Nagar [411005], FC Road [411004], Hadapsar [411028], Balewadi [411045], Baner [411045], Pimple Saudagar [411027], PCMC (Pimpri Chinchwad) [411018]
Locations Offered :
Data Analytics Course viman nagar, Data Analytics Training in kalyan nagar, Data Analytics Training in magarpetta, Data Analytics Training in pimpri chinchwad, Data Analytics Classes in yerwada, Data Analytics Classes in kharadi, Data Analytics Classes in vishrantwadi, Data Analytics Classes in deccan, Data Analytics Course in Katraj, Data Analytics Training in warje, Data Analytics Certification Training in bavdhan, Data Analytics Certification in boat club road, Data Analytics Certification in model colony, Best Data Analytics Training in pune, Data Analytics Course in pune.