Business Intelligence Course in Pune with 100% Placement Assistance
Industry-based, job-oriented, hands-on interactive training with real-time projects. Learn from working IT professionals with 16+ years of experience.
 >
>
No-cost EMI available
Business Intelligence and Analytics Training with Power BI, Tableau, DAX, SQL, & Advance Excel
Are you searching for a Business Intelligence Training institute, particularly a "near me" classroom?
Then look no further than Technogeeks!
With a placement-oriented approach to training, we serve the students in Pune, Pimpri-Chinchwad and online.
We give students the skills to get them stand on top in the competition.
Technogeeks' 110 hrs of interactive Business intelligence course training combines industry-based, job-oriented, hands-on, interactive training with assignments and real-time projects.
This course combines business analytics , data visualization, data tools & infrastructure, and best practices to help firms become more data-driven.
Having all of your company's data in one location allows you to quickly react to changes in demand and supply as well as execute positive change.
Through business intelligence methodologies and technologies, you also learn how to analyze and handle data at the enterprise level.
Business intelligence analysts need many skills.
In the course, you will learn BI tools like Power BI and Tableau with query languages like DAX (for Power BI), SQL (for Tableau or for querying from any database, excel or google sheets), PL/SQL, & advance excel.
These tools help you with
- data collection
- business data analysis
- business analytics
- database queries
- data visualization
- dashboards
- data management
You will learn the planning BI project for business data analysis and, in the end, get insights, which will help the business make prudent business decisions in an agile way.
Our trainers are experts in their fields. They simplify complex concepts for the students and make them easy to understand. They solve each and every type of student's query. Their teaching method is more focused on real-time examples, preparing the students for industry interviews. Students will have one-on-one coaching sessions with them so that they will be able to ask questions at any time.
Key Highlights of Our Trainers:
- Certified Professionals with Over 15+ Years of In-Depth Experience
- Imparted Knowledge to Over 2,000 Students Annually
- Demonstrated Strong Theoretical and Practical Expertise in Their Respective Domains
- Possess Expert-Level Subject Knowledge and Stay Current with Real-World Industry Applications
Why Choose Technogeeks?
Everything you need to launch your career in tech
Tools & Technologies You'll Master
23+ industry-standard tools covered in this program
Book Your Seat Today!
Start your journey with just ₹5,000. Watch a free demo first — pay the rest only after you're confident. No-cost installments available.
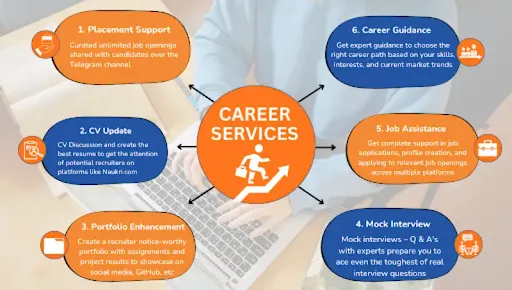
Training to Placement Journey
From your first session to landing your dream job — every step mapped out.
Frequently Asked Questions
Yes, we will provide you with placement assistance until you get a placement after course completion.
The placement team at Technogeeks is available to assist with finding work, improving resumes, getting ready for interviews, and making connections with businesses.
Many companies are advertising for people with relevant expertise as the need for BI is growing. Practical experience like this is highly valued by companies.
Anyone in the market for a new job would benefit greatly from having this. Therefore, it might benefit your career to study and get certified in business intelligence.
It's important to note that Placement assistance is not a job placement guarantee.
You can check out our Telegram Channel for Placement Assistance: https://t.me/technogeekssolutions
Business Intelligence Course is a specialisation in which learners can complete all of the four individual courses and can get a completion certificate for "Business Intelligence Course".
Or they can complete the individual sections from the course:
- Tableau Data Visualisation & Business Intelligence Course
- Power BI Visualisation & Business Intelligence course
- SQL & PL/SQL Training course
- Data Analysis with Advance Excel Course
and can get a certificate of completion for each course.
These certificates have a unique identification number to get verification when needed to demonstrate the hands-on project experience to the prospective employer.
The support staff will be able to assist you with any problems while taking the course.
And the instructor will give you 1:1 mentorship if you are stuck with any module. You will also get peer support by interacting with them on doubts you get during training.
Technogeeks' IT training courses take place as hybrid learning environments.
So the business intelligence course is available in a Pune classroom and as a live interactive online format.
After enrolling in the course, you will immediately get access to the classroom recordings & PDF notes, codes after every module.
In BI training, instructors will cover the top two BI tools in business intelligence, i.e., Tableau and Power BI.
You will also learn Advance Excel Techniques for data analysis. SQL for the query data. PL/SQL to create the triggers, execute stored procedures with parameters,etc.
But you can also complete the training for either of the four sections to get certified.
BI tools aggregate data from many sources into a data warehouse, which is then analysed using user queries, drag-and-drop reports, and dashboards.
Two of the most effective and flexible BI technologies, Power BI and Tableau, will be covered in this session. A group of related programs that work together to do a task.
Connecting to diverse data sources and developing meaningful visualizations are both possible with the help of the tools at your disposal.
The IT experts have created the outlined Business Intelligence course to give industry-based, Job-oriented interactive training with hands-on experience.
Business Intelligence Course provides placement support with a mock interview to give you first-hand experience with real interviews!
For us, the placement process is on a best-effort basis but not time-bound – in some cases, students can reach out to us even after more than six months for career guidance & placement support.
So, we guarantee placement support till you land a job!
The cost of a Business Intelligence training in Pune and online is 30000 rupees.
You can pay the fee in two parts. The registration fee of 2,000 rupees and GST are both part of the fee.
You can watch a recorded demo session before you enroll. The recorded session will be a mix of talking about ideas and doing things.
We provide live interactive training recordings for students who miss classes. It allows students to catch up on missed material and stay up-to-date with the course. It is important, however, to note that lecture recordings should not be considered a substitute for attending classes. Participating in class discussions and asking questions in person is often much more valuable.
Pune, oh, it's known as the "student's paradise" for some really good reasons. You see, this city has this amazing blend of rich educational opportunities and a vibrant, youthful culture.
First off, there are world-class universities and colleges in Pune. The place is like an educational hub.
You've got places like the University of Pune, which is a big name in itself, and then there's the Film and Television Institute of India (FTII), which is renowned globally for cinema and television education.
Some of the most visited attractions in Pune are:
- Sinhagad Fort
- Shaniwar Wada
- BAPS Swaminarayan Temple
- Aga Khan Palace
- Saras Bag
- Pashan Lake
- Khadakwasla Dam
With a student-friendly environment, it's no wonder they call it a "student's paradise."
Students from all over the country flock to Pune to enroll in various programs. And it's not just about the University of Pune; there are numerous other institutions that provide a wide range of courses, like Technogeeks.
The legacy of education in Pune is truly rich, and that's why students come here for a promising future.
But Pune isn't just about academics. Making it a hotspot for professionals, the city offers excellent job opportunities.
It's considered the second-largest IT hub in India, so tech enthusiasts find their haven here.
And let's not forget the weather. Pune boasts a lovely climate throughout the year, which is quite a relief compared to some other cities with extreme temperatures.
What Our Students Say
2,100+ verified Google reviews from real students
Our alumni works here
Join thousands of successful professionals
Find Us in Pune
Head Office at Aundh — also available online across India
Book Free Demo
Fill your details and our counselor will contact you
View All Pune Locations
Business Intelligence Course Certification Training locations in Pune :
Bajirao Road [411002], Yerwada [411006], Kasba Peth [411011], Dhanori [411015], Pune City [411022], Hadapsar S.O [411028], Airport [411032], Afmc [411040], Karve Road [410038], Ammunition Factory Khadki [411003], Aundh [411007], Dapodi [411012], Gokhalenagar [411016], Kudje [411023], Kothrud [411029], Mundhva [411036], Tingre Nagar [411000], A.R. Shala [411004], Baner Road [411004], Magarpatta City [411013], Botanical Garden [411020], Khadakwasla [411024], Lokmanyanagar [411030], Bibvewadi [411037], Bhavani Peth [411042], Dhayari [411041], Dhankawadi [411043], C D A O [411001], Shivajinagar [411005], Parvati [411009], 9 Drd [411014], Armament [411021], Donje [411025], Bopkhel [411031], Bhusari Colony [411038], Haveli [411045], Jambhulwadi [411046], Lohogaon [411047], Khondhwa [411048], Anandnagar [411051], Navsahyadri [411052], Chatursringi [411053], Gokhalenagar [411055], Warje [411058], Mohamadwadi Kadvasti [411060], Janaki Nagar [411066], Aundh [411067], Pimpri Chinchwad [411078], Nanded [411230], Gondhale Nagar [412029], Sathe Nagar [412047], Alandi Devachi [412105], Ambarvet [412115], Ashtapur [412207], Manjari Farm [412307], Phursungi [412308], Viman Nagar 411014, Shaniwar Peth [413337], Wakad [411057], Kothrud [411038], Shivaji Nagar [411005], FC Road [411004], Hadapsar [411028], Balewadi [411045], Baner [411045], Pimple Saudagar [411027], PCMC (Pimpri Chinchwad) [411018]
Locations Offered :
Business Intelligence Course viman nagar, Business Intelligence Training in kalyan nagar, Business Intelligence Training in magarpetta, Business Intelligence Training in pimpri chinchwad, Business Intelligence Classes in yerwada, Business Intelligence Classes in kharadi, Business Intelligence Classes in vishrantwadi, Business Intelligence Classes in deccan, Business Intelligence Course in Katraj, Business Intelligence Training in warje, Business Intelligence Certification Training in bavdhan, Business Intelligence Certification in boat club road, Business Intelligence Certification in model colony, Business Intelligence Training in pune, Business Intelligence Course in pune.