Table of Contents
ToggleWhat is Data Analysis?
Every decision we make in daily life involves factors like past experiences, perceptions, and beliefs. Our past experiences inform how we understand and respond to new situations and can influence our predictions about what might happen in the future!
This basic process of making decisions is a form of analytical & predictive analysis where we analyze our experience based on different factors as rough data to make informed decisions in our daily life.
Every decision we make in daily life involves considering past events. And what will occur if we proceed with that particular course of action. It is a simple everyday example of data analysis.
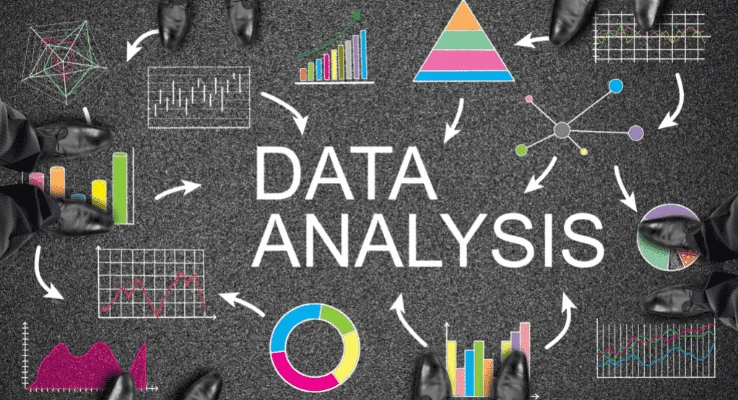
Data analysis in essence is more than making choices based on our assessment of the past to predict the future. In practice it is a subset of data science focusing on data analysis for various purposes.
The goal of data analysis is to draw out relevant information from different data sources so that decisions can be made based on fact-based analysis.
Now nearly every enterprise incorporates data analysis into its business processes. It’s a critical tool for businesses to recognize their customers’ demands and then apply that information to improve their products or services, no matter how large the firm or how dynamic the industry is.
A deep study of enterprise data can enhance customer satisfaction, retain clients, targeting, operational cost reduction, and problem-solving techniques.
Getting these insights involves cleaning, transforming, and creating models from the data to find relevant information for informed business decisions.
Why is data analysis important?
Data analysis is used to evaluate data with various statistical models.
It is critical to the success of modern businesses to optimize performance. These analytical models can help companies identify inefficient business processes and identify new ways to optimize.
Based on this analysis, key business people can make calculated decisions to drive company operations more efficiently to achieve company goals.
1) Customer Targeting
“In God we trust. All others must bring data.”
The above quote by W. Edwards Deming highlighted the role of data analysis and measurement in business decision making. Data analysis is critical in every business division to identify inefficiencies & create best practices. It can also help small business owners to identify the best products for customers.
To identify customer needs data analysis can help with the accurate profiling of customers by segmentation.
It can help understand the total market size and customer share with key metrics like population density and demographics like age, gender, economic status, etc.
Also with location intelligence, you can transform data into a source that can guide strategic and operational decision-making and identify threats and opportunities in a particular locations.
For example, In low internet speed locations companies like Facebook, Google promote the lite version of their apps.
OR
Wet & Joy’s targeting of routes of PMPML (Pune city transport) to show ads to a certain population.
You can learn more about new and existing geographic markets and reduce uncertainty by finding underserved geographic areas and hotspots for your target audience.
Identifying patterns and trends gives insight into your customers and their behavior and a strategic advantage over competitors.
All this ultimately improves the tactical and strategic planning of advertising and product mixes.
It helps allocate time, money, and resources to developing advertising campaigns for target markets with little to no interest in the goods and services you offer.
2) Reduce the cost of operations
By analyzing customer or operations data, businesses can uncover & make visible the real costs of serving and operating the different divisions. Instead of cutting costs randomly, data analysis provides insight to make strategic adjustments. Also, companies can analyze the gains from different divisions to focus on them and make changes to loss-making divisions.
Example:
E-commerce businesses can save significant money by analyzing their better product return patterns. Like for some products return cost can be higher than the initial shipping expense. Data analysis can help assess the likelihood of a product being returned so a company can take necessary steps to mitigate these losses. On the other hand, it can show which customers frequently return products and create a separate segment for these customers.
3) Improve problem-solving methods
Data Analysis is critical in problem-solving.
It helps businesses in data crunching, business analysis, and discovering new insights essential to decision-making.
It plays a crucial role in making informed decisions by providing insights and understanding of various patterns, trends and relationships in data.
By analyzing data, organizations can identify opportunities and potential risks, make data-driven decisions, and track the effectiveness of their strategies, leading to improved performance and success.
4) Reliable Information
Profitability goes up as a result of reliable, high-quality data.
Whether or not businesses can use the data to make the right decisions depends on how reliable it is.
Data that cannot be trusted makes it useless to organizations and potentially dangerous if used improperly.
To make better decisions, data must be correct. Businesses can gather relevant, precise information through data analysis, which is then used to create future marketing strategies and business plans and clarify the company’s vision or mission.
Process of Data Analysis
Data analysis follows a rigorous step-by-step process to study the data and identify patterns. Each stage requires different skills and know-how.
To get meaningful insights, it’s important to understand the data analysis process. An underlying framework is invaluable for producing results that stand up to scrutiny independent of what software or technique is used.
You can decide or develop conclusions based on the domain knowledge and data analyzed.
1. Defining The Objective of Data Analysis
The primary goal of any data analysis is to understand the business goals in depth so they can be framed correctly.
The definitive step of any data analysis project is to create the objective of the data analysis.
It can be asking the questions like, “What problem I want to Solve,”
If the objective is framed right, analysis of data & getting insights from it becomes easy. The strategies can be outlined to collect the data & from the right data source.
2. Data Collection
Before starting the data analysis, businesses need to collect the data for analysis based on business requirements. Businesses can collect data from different data sources with the help of various tools.
These sources include case studies, surveys, questionnaires, interviews, focus groups, and direct observations.
One example of a surveying tool is Survey Money, where simple landing pages of surveys can be created to collect the data directly from your target audience or a focus group.
The collected data can be either qualitative or quantitative. Each data is primarily arranged into three categories: first party, second party, and third party.
3. Data Cleaning
It is important to clean data before sending it to analysis.
Data cleaning is fixing or removing wrong, corrupted, wrongly formatted, duplicate, or incomplete data from a dataset.
Data cleaning includes,
- Removal of errors, duplicates, and variations in data added during data aggregation from multiple sources.
- Removal of unnecessary data points and unrelated observations.
- Data structuring, managing layout problems or typos, mapping, and simply plotting data.
- Identifying and closing any gaps in data with suitable data sets.
4. Analysis & Data Interpretation
The process of reviewing data and drawing relevant conclusions while utilizing various analytical techniques is known as data interpretation.
An analyst can categorize, manipulate, and summarize data with interpretation to find answers to questions.
For example, you are analyzing the age groups for a professional training institute in Pune. You can check their age group and what kind of software training or IT training they prefer. They can create a marketing strategy to engage uninterested groups or an outreach strategy to expand their core user base through time series analysis, regression analysis, or univariate and bivariate analysis.
There are different ways to analyze data and interpret it.
It depends on the goal of this analysis and what we hope to accomplish.
Four categories can be used to group the types of data analysis.
These categories are,
- Prescriptive analysis
- Predictive analysis
- Diagnostic analysis
- Descriptive analysis
5. Sharing Insights
It is the last and most important step in the analysis, where results are shared with stakeholders & decision-makers.
This step is more than sharing the raw results of the whole process!
This step is more than sharing the raw results of the whole process!
It’s important to present the results so the intended audience can understand them.
The findings should be presented clearly so that they are 100% clear and straightforward with no implication of possible ambiguity about results.
Because of this, reports, dashboards, and interactive visualizations are frequently used to visualize the data analysis conclusions.
These results can influence the direction of an organization and public policy decisions. Here you meet ethical questions like Honest communication,
highlight any gaps, flagging any insights that might be open to interpretation.
Ensuring that you cover everything concisely and in simple terms.
Tools Used in Data Analysis
Tools are important in modern data analysis, from data gathering to cleaning, interpreting, and sharing the results. Software like MS Excel, Tableau, and Power BI is used to connect the gathered data with connectors and SQL to query the data for required information.
To Mine & gather or collect the data, Python web scrapers and crawlers are used at smaller levels & scales depending on the sample size of data.
Following are some tools used by Data Analysis professionals to gather the data for raw insights to gather business insights on metrics such as demographics.
Survey Tools
- Survey Monkey
- MonkeyLearn
- Google Forms
- Typeform
- Jotform
- SoGoSurvey
- SurveyPlanet
- Zoho Survey
- Crowdsignal
Data Modeling
In data modeling, data objects & their relationships to other objects are mapped and analyzed. It is used to analyze the data requirements required for business processes. The data models are created to store the data in a database.
These tools enhance productivity and simplify data modeling tasks.
Professionals can use these tools to create, browse and edit logical, relational, physical, multi-dimensional, and data-type models.
Following are the most commonly used Data Modeling tools,
- Draw.io
- Lucidchart
- SQuirreL SQL Client
- MySQL Workbench
- Amundsen
- Erwin Data Modeler
- ER/Studio
- Datagrip
- SQL Database Modeler
- DbSchema Pro
- Erwin Data Modeler
- Archi
Data Integration
Data integration is a data preprocessing technique that combines data from multiple heterogeneous data sources to analyze and visualize on dashboards.
Some of the tools commonly used for data analysis also provide data connectors to connect data with the tool.
Some examples are Excel’s data for external data, Power BI’s various data connecting apps, and Tableau’s native & apps to connect data.
Reports as Interactive Dashboards
As discussed earlier, to present a clear message to decision-makers, they need to understand the data precisely.
Data analysis professionals use tools like
- Python Libraries
- JavaScript frameworks & libraries
- R language
- Excel
- Power BI
- Tableau
To present the final reports as interactive dashboards to derive insights easily.
Query & Programming Languages
Data analysis professionals use SQL to query databases, while programming languages like Python or R are used to process and analyze data.
Python is commonly used for main data analysis functions: clean, manipulate, analyze, and visualize data over R.
Techniques and methods used in data analysis
Based on business and technology, various sorts of data analysis approaches exist. But the most common techniques for data analysis are,
- Descriptive Analysis
- Diagnostic Analysis
- Exploratory Analysis
- Inferential Analysis
- Predictive Analysis
- Causal Analysis
- Mechanistic Analysis
- Statistical Analysis
Descriptive Analysis
The descriptive analysis generates simple summaries of the sample data and measurements.
Common descriptive statistics are measures of central tendency, variability, frequency, position, etc.
The first step in the analysis is to summarize and describe the data.
Example:
Google Analytics’ dashboards are the most commonly used graphical presentation of website data.
You can check the website traffic/users in various tabs from cities like Pune and Mumbai.
The most common Google Analytics charts used to describe data are bar graphs, pie charts, line graphs, and Cartesian graphs.
Diagnostic Analysis
In this approach, historical data is typically preferred over other data when providing an answer or resolving a query.
We search for any dependencies and patterns related to the specific issue in the past data.
The analysts should seek out parallel patterns from the past and, ideally, use those solutions to address the problems presented.
Statistical Analysis
Statistical Analysis is a branch of mathematics that deals with the collection, Analysis, interpretation, presentation, and organization of data. This Analysis involves statistical methods and models to describe and make inferences about a population based on sample data. The goal of statistical Analysis is to extract meaningful insights and conclusions from data and to make decisions based on this information. It is used in business, economics, biology, psychology, and many more fields to solve real-world problems and support decision-making. Some common statistical methods used in data analysis include hypothesis testing, regression analysis, and ANOVA (Analysis of Variance).
Predictive Analysis
Predictive analysis uses historical data to show “what is likely to happen.” Using predictive analytics, the data is transformed into useful information that may be used. Analytics that forecast results and the frequency of events use data to make these predictions.
Prescriptive Analysis
Prescriptive Analytics combines large data sets, mathematical science, business rules, and machine learning to generate a forecast and then provides insights to monetize the results. Most data-driven businesses use prescriptive analysis since descriptive and predictive analysis alone cannot improve data performance. Businesses can use prescriptive analytics to make decisions based on the difficulties and circumstances present in the market.
Exploratory Analysis
Exploratory data analysis (EDA) is a crucial step in data analysis.
We can ask important questions with EDA that have an impact on business.
To explain and understand the relationship between variables and how these can affect business, it uses various statistical tools and data manipulation techniques.
It allows for a thorough understanding of the dataset, the definition or rejection of hypotheses, and the development of predictive models with a firm foundation.
Career in Data Analysis
Build a rewarding career and learn skills that make you stand out
Some of the most sought-after professionals worldwide are skilled data analysts. Data analysts command high salaries and top benefits, even at the entry-level, due to the high demand for their services and the scarcity of qualified candidates.
By 2026, it is anticipated that the data analytics sector will have added over 11 million jobs.
Create a fulfilling career for yourself and acquire unique skills.
You might assist in creating research studies for scientific research, depending on the industry or sector. For instance, we analyze risk using statistical software in the insurance industry. They search for trends and patterns to assist organizations and the government in making policy decisions.
As you’ll be eligible for the following jobs
1) Data Analyst
2) Business Analyst
3) Research Analyst
4) Risk Analyst
5) Data Journalist
6) Business Intelligence Analyst
7) Market analyst


